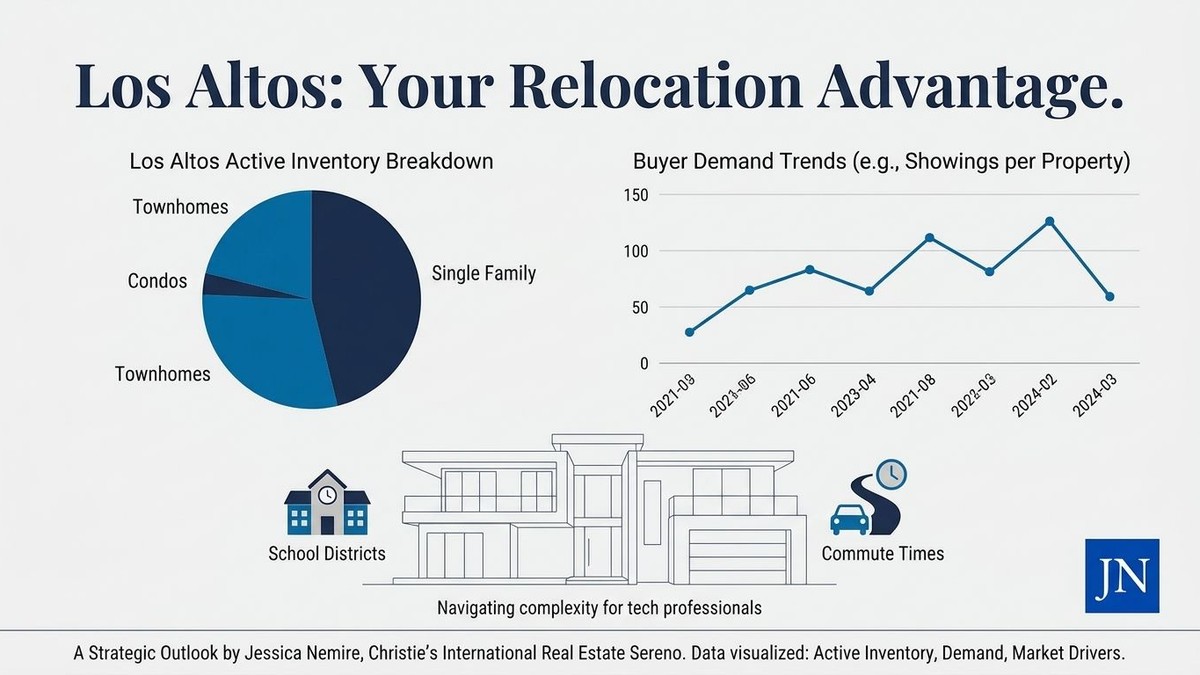
October Los Altos Housing Market Data and Macro Analysis
Welcome to our comprehensive October 2026 data review focusing on current real estate dynamics. The Los Altos housing market continues to demonstrate sustained resilience despite broader macroeconomic shifts and interest rate fluctuations. We track specific localized metrics, such as transaction volume and days on market, to provide high-net-worth clients with objective financial insights. As senior tech professionals relocate to Silicon Valley from out of state, understanding these local micro-climate variations becomes absolutely critical for asset preservation. Our quantitative analysis breaks down exactly how current inventory constraints and median sale prices dictate optimal acquisition strategies for incoming executives.
Table of Contents
- Current Los Altos Housing Market Indicators
- Macroeconomic Drivers Influencing Buyer Demand
- Strategic Relocation Advisory and Commute Analysis
- Structural Challenges for Out-of-State Buyers
- Quantitative Methodology for Asset Selection
- Frequently Asked Questions
Current Los Altos Housing Market Indicators
The defining characteristic of the Los Altos housing market this quarter is a severe constraint on active inventory across all neighborhood quadrants. We are currently observing just 1.2 months of supply, which indicates a highly illiquid market that structurally favors property sellers. When local supply drops below a three-month threshold, market bifurcation typically occurs, separating turnkey luxury estates from properties requiring significant capital expenditure. For incoming tech executives, this constrained metric means that well-positioned assets trade rapidly and rarely experience price reductions. Analyzing the specific price-per-square-foot data reveals exactly where these valuation premiums are being placed by active market participants.
Active Inventory and Months of Supply
Active inventory represents the total number of residential properties available for acquisition at a given moment, serving as a primary indicator of overall market health. In Los Altos, the current inventory level remains significantly depressed compared to historical averages recorded over the previous decade. This ongoing structural shortage is largely driven by existing homeowners holding fixed-rate mortgages well below four percent, creating a lock-in effect that stifles transaction volume. Furthermore, new residential construction in the area is functionally non-existent due to strict municipal zoning laws and high capital costs for developers. As a result, out-of-state buyers must be prepared for swift liquidity events when financially viable properties finally enter the market.
Median Sale Prices and Valuation Metrics
Tracking the median sale price provides a fundamental baseline for understanding capital requirements within this specific Bay Area micro-climate. Currently, the median transaction in Los Altos is closing at approximately 4.25 million dollars, representing a steady but controlled appreciation curve year-over-year. However, looking solely at the aggregate median price obscures the underlying price-per-square-foot metrics, which currently average 1,850 dollars depending on precise neighborhood boundaries. Properties positioned on prime flat lots with updated electrical and plumbing infrastructure command significant market premiums, often trading well above the 2,000 dollar per square foot mark. We consistently advise our clients to evaluate these granular metrics comprehensively to ensure their capital is deployed efficiently into appreciating assets.
Macroeconomic Drivers Influencing Buyer Demand
Buyer demand in Silicon Valley operates largely independently of national real estate trends due to the dense concentration of artificial intelligence wealth and localized equity events. While national housing markets react violently to the Federal Reserve adjusting monetary policy, the localized demand curve is heavily buffered by high percentages of all-cash acquisitions. Interest rates, currently stabilizing near the six percent threshold, have shifted the base cost of capital but have not materially diminished the purchasing power of senior technology professionals. We monitor these macroeconomic factors meticulously to forecast short-term demand spikes that predictably follow major corporate initial public offerings or positive quarterly earnings reports. Understanding this direct correlation allows relocating buyers to time their market entry effectively before localized liquidity events drive asset prices upward.
Additionally, the liquidation schedules of restricted stock units dictate the seasonal rhythm of transaction volume in our specific geographic area. When major local employers release stock grants, we observe a measurable surge in buyer demand within thirty to sixty days as capital floods the residential sector. This localized equity creation allows buyers to bypass traditional financing constraints entirely, rendering standard national interest rate models less predictive. Consequently, understanding the exact timing of corporate liquidity events is just as vital as tracking broader mortgage rate fluctuations. We integrate corporate vesting schedules into our pricing models to anticipate competitive bidding environments before they fully materialize.
Strategic Relocation Advisory and Commute Analysis
Navigating this complex landscape from outside California requires a rigorous, data-centric approach to real estate property acquisition. Our advisory framework goes far beyond standard transactional services to provide comprehensive spatial data analysis for relocating corporate professionals. We quantitatively evaluate commute vectors, municipal infrastructure updates, and neighborhood zoning regulations to align property selection with long-term financial objectives. Every acquisition must be strictly underwritten not just as a primary residence, but as a high-stakes financial asset within a diversified investment portfolio. For out-of-state buyers, applying this level of analytical rigor prevents costly misallocations of capital in an unfamiliar geographic region.
Commute Times and Asset Liquidity
Commute times directly impact property valuations and long-term asset liquidity throughout the entire Silicon Valley corridor. Properties located within a fifteen-minute transit radius of major technology campuses in Mountain View or Palo Alto historically maintain tighter valuation spreads during economic market downturns. We utilize localized traffic data sets and municipal infrastructure planning reports to project future transit friction for all prospective buyers. A residential asset situated near arterial transit corridors will consistently attract a much wider pool of secondary buyers when the time comes to liquidate the property. Therefore, calculating precise commute dynamics into the initial purchase price is a mandatory component of our valuation modeling process.
School District Boundaries and Property Values
Hyper-local neighborhood variations, particularly specific school district assignments, dictate pricing structures down to the individual street level. In Los Altos, properties zoned for top-tier municipal schools reliably command an average valuation premium of ten to fifteen percent over comparable homes positioned just one block outside the boundary line. This educational zoning premium remains remarkably stable across various economic cycles, effectively acting as a financial hedge against broader market volatility. We carefully map these exact boundaries against current active inventory to identify potential pricing arbitrage opportunities for our client base. Understanding these strict spatial economics is absolutely critical for out-of-state buyers who might otherwise misinterpret a property listing price.
Structural Challenges for Out-of-State Buyers
Technology professionals relocating to the Bay Area frequently face an initial data deficit regarding neighborhood micro-climates and pricing norms. Without direct access to historical transaction data and off-market inventory pipelines, incoming buyers risk overpaying for structurally compromised real estate assets. The sheer velocity of the market demands that buyers establish a localized financial framework well before they physically arrive in the state for property tours. This accelerated timeline requires having capital structured and valuation models finalized well in advance of any active negotiations. Incoming executives must operate with institutional-level discipline to secure premium properties in such a tightly constrained environment.
Without a rigorous analytical partner to interpret off-market data and historical pricing trends, out-of-state buyers are placed at a severe informational disadvantage. We bridge this significant gap by supplying incoming executives with comprehensive spatial data, historical price-per-square-foot analysis, and projected asset liquidity timelines. By the time a financially viable asset enters the market, our clients have already modeled the potential financial outcomes and established firm acquisition parameters. Treating the corporate relocation process as a strategic corporate acquisition ensures that clients can execute their real estate strategy with precision and absolute confidence. If you require detailed market metrics for your upcoming move, please consult our relocation advisory data portal.
Quantitative Methodology for Asset Selection
Our analytical methodology is strictly grounded in quantitative analysis and objective market metrics rather than emotional sales appeals. We view every single real estate transaction as a significant capital allocation requiring thorough financial due diligence and comprehensive risk assessment. By integrating broad macroeconomic trends with granular street-level pricing data, we provide a complete financial picture for high-net-worth clients moving to the area. Our explicit role is to translate complex economic indicators into clear, actionable intelligence that strongly supports long-term wealth preservation. Buyers and sellers consistently rely on our analytical framework to navigate the inherent financial complexities of the current housing environment.
In a market characterized by high asset values and constrained supply, relying on anecdotal evidence or basic listing platforms is a fundamental strategic error. We aggregate data from multiple private listing services, municipal tax records, and local economic forecasts to build predictive models for specific zip codes. This data-first approach allows us to identify properties that are mathematically undervalued relative to their geographical positioning and structural condition. Our clients benefit from this rigorous institutional mindset, ensuring their capital is protected and positioned for optimal long-term growth. We invite you to explore our full suite of analytical real estate services to support your acquisition strategy.
Frequently Asked Questions
What defines the current months of supply locally?
Months of supply is a fundamental macroeconomic metric that calculates how long it would take to liquidate all active inventory at the current pace of closed transactions. Currently, we are tracking approximately 1.2 months of supply, which indicates a highly constrained market heavily favoring sellers. A balanced market typically requires four to six months of available supply to normalize pricing leverage between negotiating parties. This data point is critical for setting expectations regarding negotiation leverage and projected time on market for new listings.
How do interest rates impact local housing dynamics?
While national markets are highly sensitive to Federal Reserve rate adjustments, Silicon Valley exhibits significant insulation due to concentrated local wealth. The high volume of all-cash acquisitions and massive liquidity events from restricted stock units means that mortgage rates play a secondary role in local pricing dynamics. Although stabilized rates around six percent have shifted the base cost of capital, they have not fundamentally suppressed buyer demand for premium residential assets. We continually map these rate fluctuations against local tech stock performance to generate highly accurate predictive pricing models.
How do school district boundaries affect property values?
Yes, municipal school district boundaries are one of the most statistically significant variables in calculating local property valuations. Homes situated within the most sought-after educational zones frequently command a ten to fifteen percent pricing premium over architecturally identical homes located just one street over. This valuation premium remains incredibly resilient during broader economic downturns, serving as a reliable mechanism for long-term wealth preservation. We mathematically incorporate these zoning boundaries into all of our comparative market analyses to prevent clients from misinterpreting baseline property values.
How can buyers evaluate commute times effectively?
Relocating buyers must utilize spatial commute analysis rather than relying on generic mapping software to evaluate transit friction. We analyze municipal traffic density reports, infrastructure expansion plans, and corporate shuttle routes to project realistic daily time expenditures. Understanding these precise transit vectors allows us to quantify the exact financial premium assigned to spatial convenience in various neighborhood quadrants. To begin optimizing your spatial acquisition strategy, we encourage you to review our corporate relocation advisory resources.